Introduction:
Gait is the methodical study of human motion. The purpose of gait is to help those who have conditions that affect their ability to walk, making it important for medical diagnostics and bio-mechanics. Gait analysis can be measured using accelerometers, which measure the physical acceleration experienced by an object. In this experiment, we will do a gait analysis to answer the question, “What is the relationship between the leg length and gait frequency for walking humans?” We hypothesize that the longer the leg, the lower the gait frequency because the person will have a longer stride. In this project, we measured a persons length length (inches) and walking frequency (Hz). With this information, taken from a handful of subjects, we were able to predict a person's leg length based on their walking frequency and vice versa.
|
|
|
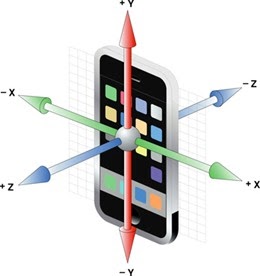
Accelerator image above. This tool measures a person's movement in relation to their vertical, lateral and anterior axis. During our project, this application was used and attached to the subject's lower back to collect our data.
Content:
Gait: The stride of a human as s/he moves his/her limbs.
Gait Frequency: Rate of stepping/ second
Gait Analysis: The methodical study of human motion, using observations and measurements.
Accelerometer: A device that measures the physical acceleration experienced by an object
Acceleration: increase in the rate or speed of something.
Symmetry: In terms of gait analysis, the quantification of differences between left-foot and right-foot steps.
Variability: In terms of gait analysis, the quantification of fluctuations from one stride to the next
Frequency: number of occurrences of a repeating event per unit of time
Model: In technology, a description of observed or predicted behavior of some system, simplified by ignoring certain details. Models allow complex systems to be understood and their behavior predicted
Dynamicity: In terms of gait analysis, the quantification of variations in kinematic or kinetic parameters within a step
Force: An interaction that results in a push or pull on another object. Equation is mass(Kg) times acceleration (m/s^2). Measured in Newtons
Trendline: A line that indicates the general tendency of data
Reflection:
This project has been a great way for my group and me to improve very important life skills: leadership, problem-solving, and collaboration. We worked well as a team and were able to successfully find an equation that correlated to the data we had collected. I could have improved on time management and always working productively during the class, which I will strive to achieve in the upcoming project. I learned how to problem solve productively because of the challenges we faced in the development of our product. Our first equation we created did not match up with our data as effectively as needed. We created a new equation and trendline that correlated with our data. We also took data from other groups to ensure our trendline and equation were correct. Towards the end of the project, my collaboration improved dramatically. I helped in creating graphs and the equation, which connected with the data. We experienced a lot of trial and error but in the end we had a completed project that was efficient and that we were proud of!
